Average directional movement index, ADX is a very popular forex trend analysis trading indicator amongst forex traders. It is an indicator that can helps you gauge strength of the asset of interest. Is it worth you taking a position or staying out of it. To truly appreciate power of this indicator, you need to have a deeper understanding of how it works. For this reason, keep reading to the end.
The average directional movement index is a powerful tool. Combined with other indicators, this tool can become your goto indicator. You can begin to see the market’s rhythm and the confidence of placing trades with unbiased view. Here at Sirius forex trading floor, this is what we do.
Average Directional Movement Index, Components Explained
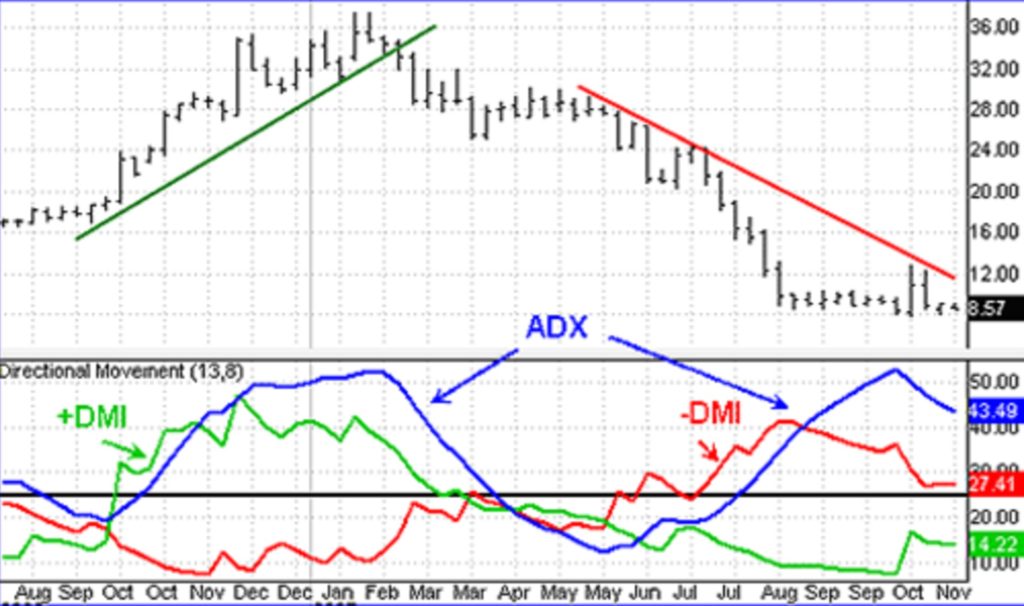
There are three components to this indicator. The first part is the ADX line itself. This line determines the strength of the trend regardless of which direction the asset might be going. This why it is so powerful because, if you can see this move early enough you can take your trading position.
when to “buy” or “sell” using the strength of the average directional movement line in correlation the crosses of positive D, +D and negative D, -D lines.
A trend is deemed strong when the index is above 25. And while the search can be fascinating, the result is always the same. The truth is, there is no one way to trade the forex markets. As a result, successful traders must learn that there are a variety of indicators that can help to determine the best time to buy or sell a forex cross rate.
Here are four different market indicators that most successful forex traders rely upon.